Week 5 - Data Analysis and Visualisation
This is the fifth week of Digital Practices.
This Week:
- Description:
- Reflection:
- Work to be done for next week:
We’ll be using the data we collected last week and analyzing and visualizing this. There are a lot of tools we can use to help us with this, including excel. It communicates a lot better to people, a bit like storytelling. Making it easier to identify what is happening with the data, identifying patterns and using this as a research method.
I managed to successfully complete the tasks from my dataset and expanded on this. Therefore, I am able to visualize this data via pie charts and bar charts. From this I can see how many games England have played at home vs overseas, as well as how many games they won at home vs overseas. So that I can answer my initial question of why England aren’t doing well at the world cup this year and I can say that England have played more games at home in both cycles (2015-19, 2019-23) and are also more successful at home which is why they performed better in the 2019 world cup as they hosted it and won the world cup. Whereas, England do not do as well in subcontinent conditions (Asia) and have played far fewer games as well which could be the reason why they aren’t doing great.
I could try refining the dataset or look at other teams. I could also try new methods to analyse and visualise data. For now I think I did a good job at trying to answer my initial question I had last week.
Overall Thoughts and Images:
I really enjoyed doing this and I can see why it is important to analyse and visualise data. When you are trying to find answers, it can really help to do this. For me, I was able to find my answer and can say that England have not done that great because they have played fewer games and fewer games in the subcontinent. Therefore, this is why they have not performed so great at the world cup this year as it is hosted in the subcontinent. I also used a lot of different formulas which i haven't used in order to analyse the data such as COUNTIFS, to count how many games England won at home vs overseas.
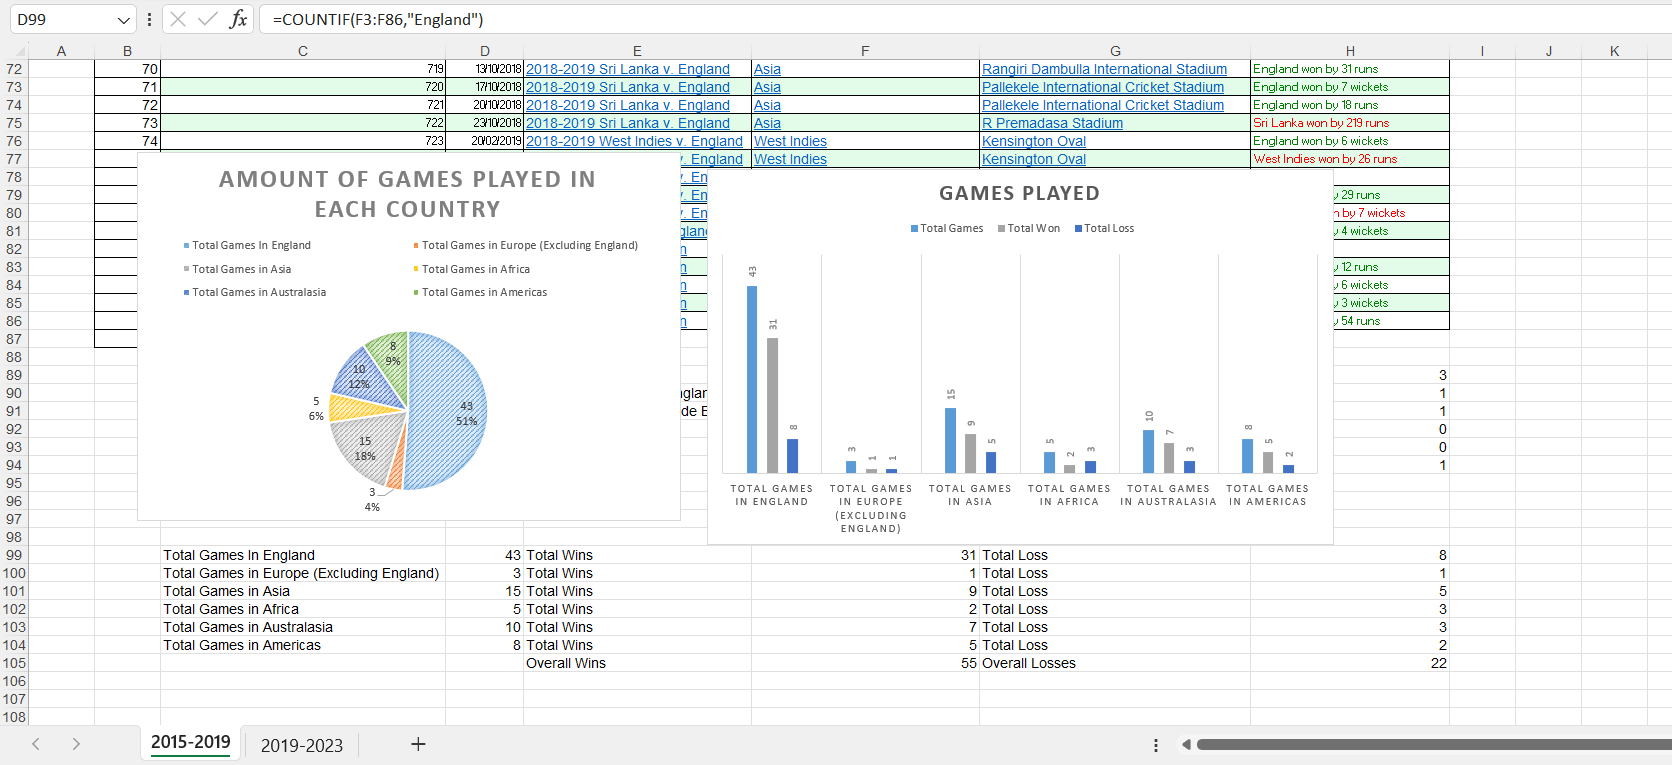
This is an image of the 2015-2019 games which shows that England played more games at home which helped as they hosted the 2019 world cup.
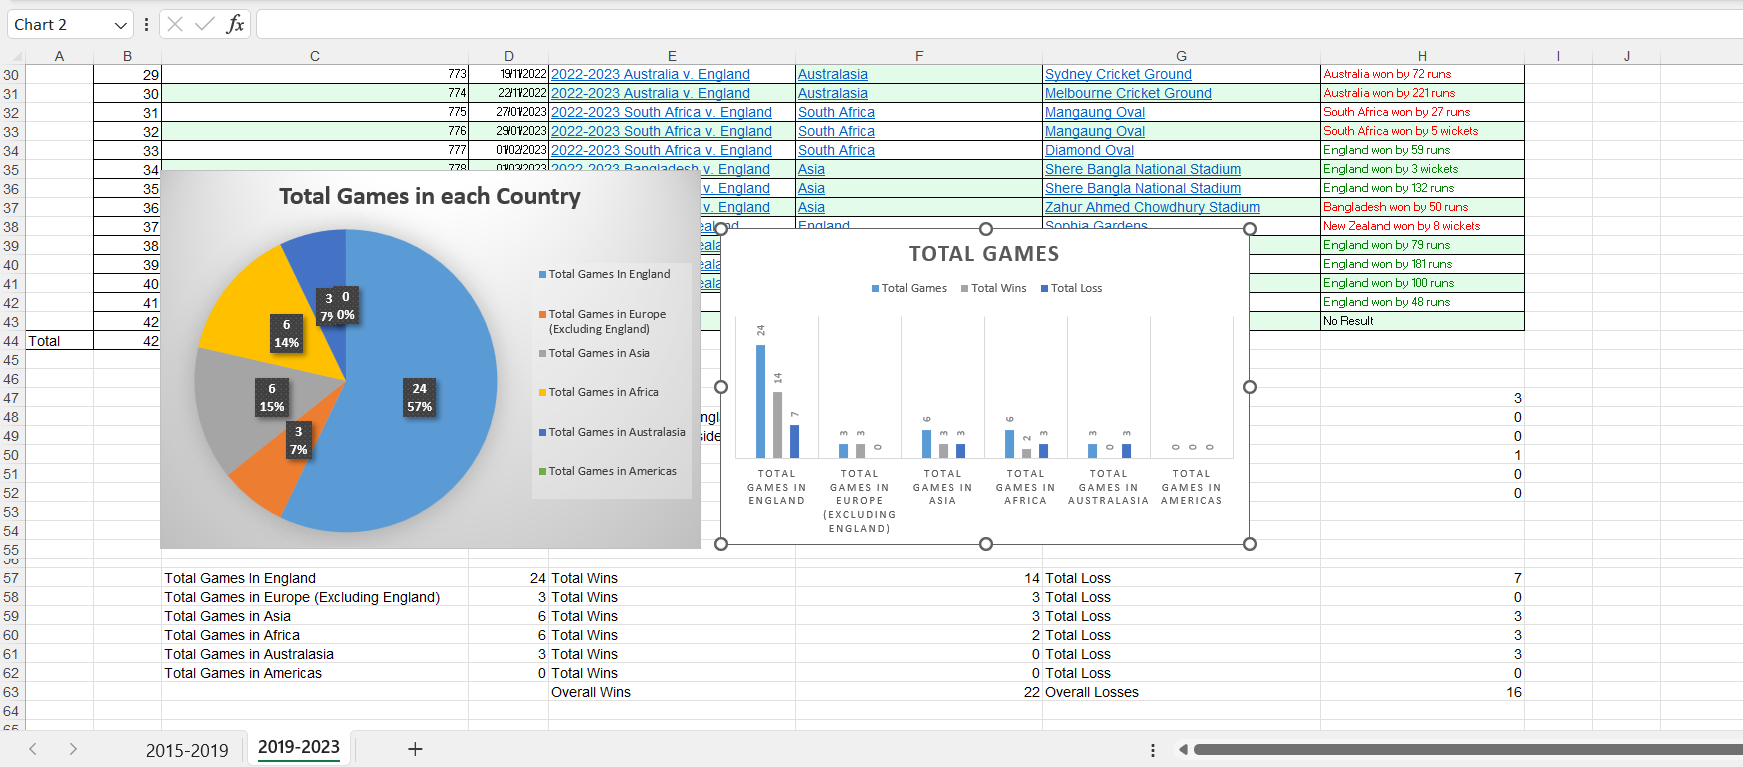
This is an image of the 2019-2023 games which shows that England still played more games at home but a lot fewer games in total. There was not many games played in the subcontinent too which the world cup is currently being held.